Sample · before and after
The same algebra lesson, two ways.
Most course materials save equations as pictures. A screen reader can't read a picture, so a blind student hears "graphic" where the math should be. Below is one short lesson both ways. Press play to hear what a student would hear.
Lesson written by Proof & Plain for this sample, November 9, 2026.
Before
Equations as pictures
Finding the vertex of a parabola
A quadratic function has the form 
Its graph is a parabola. The vertex is the turning point. Its x-coordinate is 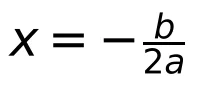
Example. Find the vertex of 
Here a is 1 and b is −4, so 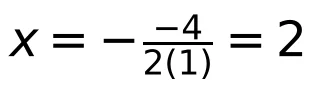
Then 
This panel deliberately repeats a common mistake, so the images here have no text alternatives.
What a screen reader says
Heading: Finding the vertex of a parabola.
A quadratic function has the form
graphic
Its graph is a parabola. The vertex is the turning point. Its x-coordinate is
graphic
Example. Find the vertex of
graphic
Here a is 1 and b is negative 4, so
graphic
Then
graphic
graphic
graphic
After
Fixed by Proof & Plain
Finding the vertex of a parabola
A quadratic function has the form .
Its graph is a parabola. The vertex is the turning point. Its x-coordinate is .
Example. Find the vertex of .
Here a = 1 and b = −4, so .
Then . The vertex is (2, −1).
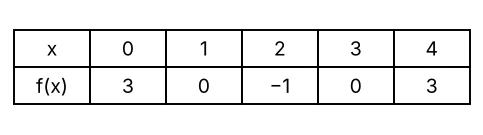
| x | 0 | 1 | 2 | 3 | 4 |
|---|---|---|---|---|---|
| f(x) | 3 | 0 | −1 | 0 | 3 |
What a screen reader says
Heading level 2: Finding the vertex of a parabola.
A quadratic function has the form f of x equals a x squared plus b x plus c.
Its graph is a parabola. The vertex is the turning point. Its x-coordinate is x equals negative, b over 2 a.
Example. Find the vertex of f of x equals x squared minus 4 x plus 3.
Here a is 1 and b is negative 4, so x equals negative, negative 4 over 2 times 1, which equals 2.
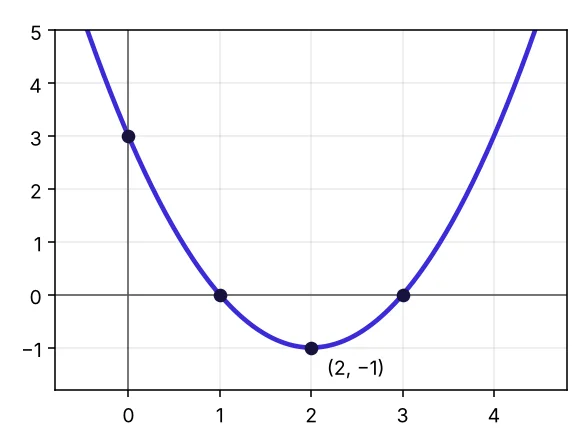
Then f of 2 equals 2 squared minus 4 times 2 plus 3, which equals negative 1. The vertex is the point 2, negative 1.
Figure: graph of f of x equals x squared minus 4 x plus 3. An upward-opening parabola that crosses the x-axis at 1 and 3, crosses the y-axis at 3, and has its lowest point at 2, negative 1.
Table with 2 rows and 6 columns: values of f of x. x 0, f of x 3. x 1, f of x 0. x 2, f of x negative 1. x 3, f of x 0. x 4, f of x 3.
Depending on the screen reader, a picture with no text alternative is announced as "graphic", "image" or its file name. Spoken math wording varies by screen reader; the text above follows common speech rules. Play uses your browser's built-in voice.
The check report
| Element | Before | After |
|---|---|---|
| Equations | 5 pictures of equations | 5 MathML equations a screen reader can speak and navigate |
| Graph | Picture with no description | Labeled graph with a full text description |
| Table of values | Picture of a table | Real table with header cells |
| Zoom and reflow | Equations blur when enlarged | Equations stay sharp at any size |
| Heading | Bold text only | Real heading |
Every order also includes a tagged PDF that follows the same reading order, and a one-page report like this one.
See your own material fixed
Send one section, up to 8 pages. We convert it free and send it back in 3 business days.
Then $6 a text page, $10 a math-heavy page, or $350 a chapter.